Predictive Maintenance Model in Microsoft Azure Cloud
This is an experiment worked by Joseph Pareti, UberCloud, and Microsoft, and it is based on a Microsoft Open Source Sample. It involved renting adequate Azure capacity to run the 4 stages of the pipeline:
- data ingestion
- features engineering
- model evaluation (in this study we used an ensemble model ‘random forest’ to generalize better than using a simpler decision tree model)
- model operationalization
Despite having established domain-specific features that are carefully engineered to reproduce the failure patterns of an hypothetical machine consisting of 4 components, and for which telemetry (=e.g. from sensors, IoT) and maintenance records are available, the recall rate turned out to be just 0.26, which is not adequate for productive deployments. Recall is key for this class of problems where one wants to avoid false negatives.
Possible improvements are data augmentation to reduce the imbalance of failure vs. health records. The link above is about the second implementation of the model, delivering the same perfomance, but completing faster than version 1 thanks to a better implementation on Azure Machine Learning Service SDK and Databricks.
On a more positive note, I observe many predictive models available in field are just based on sensors data. While important, these are only telling part of the truth. The model we worked on takes into account a time series of events leading to a component failure; the modeling of features including number of days a component has been in service, the alignment of maintenance records with telemetry records, as well as labels backfilling to label the x days prior to a failure as failures are important aspects for any practical application. Therefore I believe this is a sound implementation that could be used as a template for custom projects, or the stepping stone for a digital twin, while requiring more in depth data analysis for improving the recall rate.
This is a project to identify customer segments to increase sales. It is based on a demographic file containing ~900K records, and a ~200K customers’ records file. This is an application of unsupervised learning techniques such as k-means clustering and of Principal Components Analysis.
Each row of the demographics files represents a single person, but also includes information outside of individuals, including information about their household, building, and neighborhood. This information is used to cluster the general population into groups with similar demographic properties. Then, the people in the customers dataset are mapped into those created clusters. The result is that certain clusters are over-represented in the customers data, as compared to the general population; The information can then be used for further applications, such as targeting for a marketing campaign.
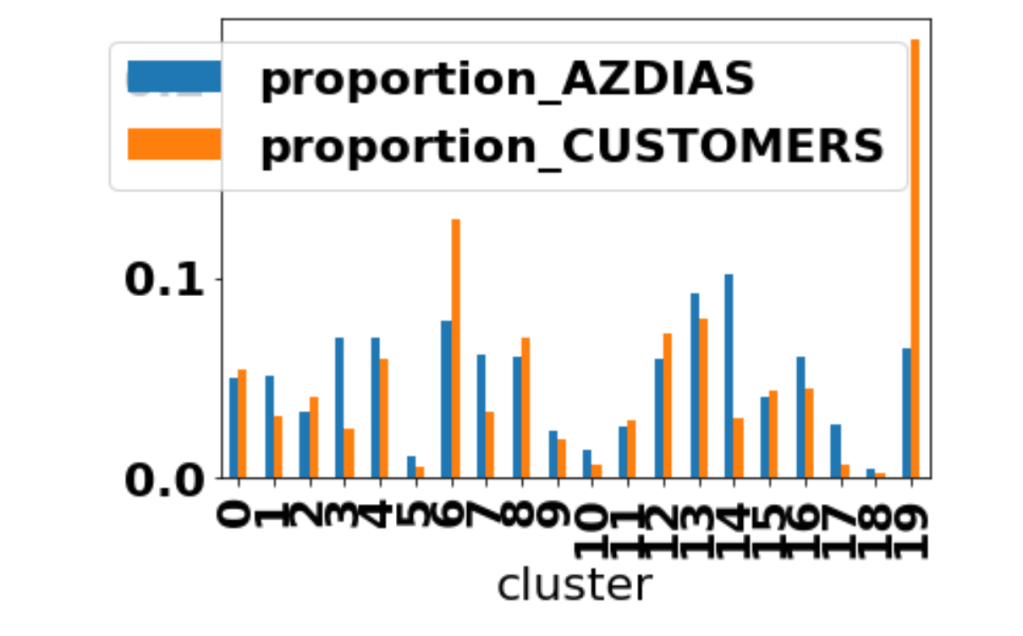
In the diagram above, cluster 6 and 19 are groups of individuals that are over-represented in the customer database than in the general population: a marketing campaign aimed at expanding the company sales could target precisely those groups.
Image Classification using PyTorch
This project is about a supervised learning model that uses a pre-trained Convolutional Neural Network, such as DENSENET, where the last layers are replaced for the purpose of classifying different types of flowers.
This GitHub repo is a preparation step for the full fledge project:
- specific code in Pytorch used for forward propagation: classes & methods
- Gradient calculation tutorial cases using Autograd are illustrated here.
Additional Experimentation with PyTorch : trainloader, loss, SoftMax, Inference, Checkpoint. The latter is about validating the checkpoint code using the Fashion-MNIST dataset.
